607 – How’s you call health?

clip_image002When the pandemic first hit, many people realised that fast, reliable home broadband was an essential utility rather than a nice-to-have. With potentially more people in the house sharing the connection all day, streaming video and doing online meetings, contention in the domestic environment became something of an issue, where one user can hog the available bandwidth to the detriment of others.

The same issue occurs en masse at the broadband provider’s network, where their resources are shared between users on the assumption that they won’t see all of them demanding full speed at the same time: a contention ratio of 50:1 is pretty common, meaning if your neighbours are hammering their connection then it may affect you (assuming you’re on the same provider).

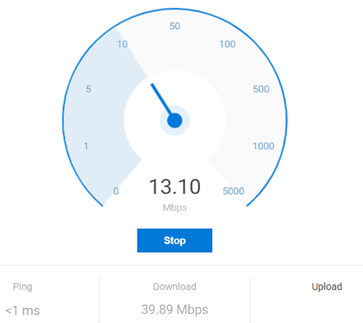
clip_image004By now, we should all be used to the challenge of making your home network better – plugging into a wired network port to avoid poor WiFi signal, making sure other devices don’t do massive downloads during the working day. Check the speed of your network using one of the many tools available – like this one from Microsoft Research; if you search on Bing.com for just speed test then you’ll get a simple speedometer view.

If you’re using Teams or other realtime conferencing tools, it’s arguably more important to look at the latency (or “ping”) and the upload speed, than focussing on the headline download speed; if you have a device uploading lots of data, it might rob your bandwidth and ramp up the latency, which will be the enemy of any kind of synchronous comms. Check your latency over time with an online tool (like TestMy Latency) or download WinMTR to look for spikes in latency.

It’s worth making sure your PC isn’t causing issues itself, by running out of memory or pegging out the CPU and therefore giving a poor experience: the topic of looking for poor home network perf has been covered previously in ToW #533 amongst others.

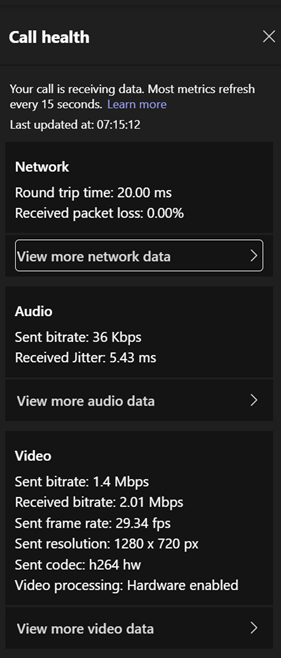
clip_image006clip_image008Microsoft Teams has added some built-in monitoring and data collection capabilities, reported back to a central admin dashboard (Set up Call Quality Dashboard (CQD), and now semi-realtime data is visible in the Teams client itself. 

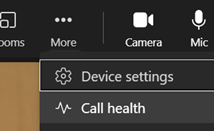
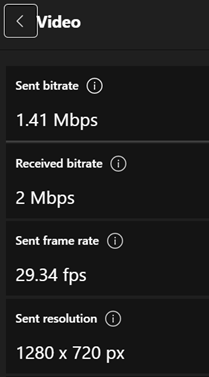
clip_image010When in a call, go to the menu and look for Call health. Click on the various “view more… data >” buttons to see further detail, like the size and rate of the video you’re sending to the call you’re currently on. If your colleagues tell you that the quality of your video is poor, take a look in there to see what you’re actually sending.

As an end user, see here to understand how to interpret the various data. Hover over the little info icons to the side of each headline to see a bubble explaining in one-line what this is measuring. It’s quite interesting.

For admin guidance on what bandwidth and latency requirements you should have to perform acceptably, see here.